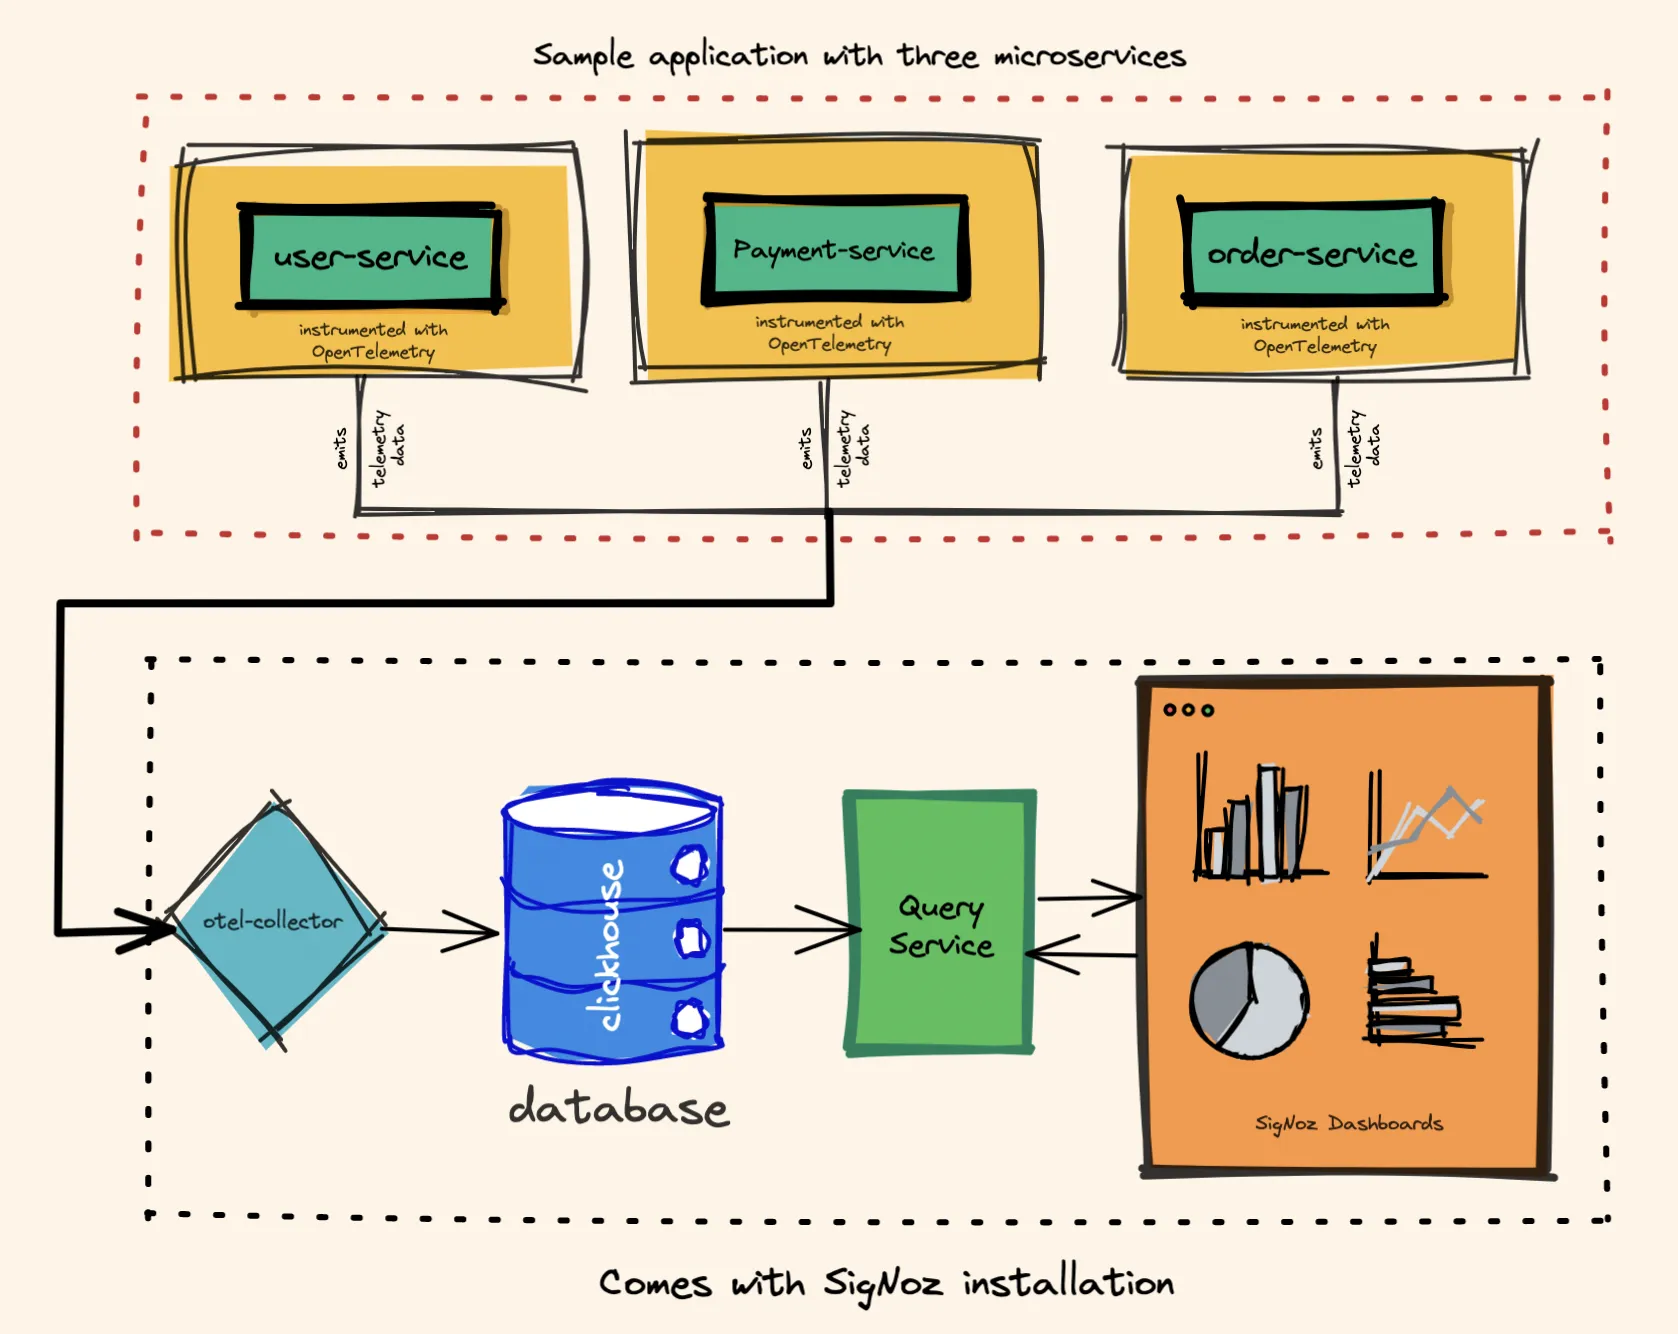
OpenTelemetry is a powerful tool for collecting and exporting telemetry data, but getting that data into a database like PostgreSQL for analysis and visualization requires a bit of setup. This post will guide you through the process, explaining various methods and best practices to efficiently ingest OpenTelemetry data into your PostgreSQL instance. We’ll focus on practical solutions and provide examples to help you get started quickly. Successfully integrating OpenTelemetry and PostgreSQL will unlock valuable insights from your application’s performance and behavior.
Exporting OpenTelemetry Data to PostgreSQL
The core challenge lies in bridging the gap between OpenTelemetry’s export mechanisms and PostgreSQL’s data ingestion capabilities. OpenTelemetry offers several exporters, each with its strengths and weaknesses. Choosing the right exporter is critical for ensuring smooth data flow and optimal performance. Common options include the Prometheus exporter (often paired with a bridge to PostgreSQL) and custom solutions using various programming languages to process and format the data before ingestion. We’ll delve into the practical considerations for selecting and configuring the most appropriate method for your use case, emphasizing efficient data handling and error prevention. Factors like data volume, desired data structure, and existing infrastructure must inform your decision.
Using the OpenTelemetry Collector and a Custom Exporter
One popular approach involves leveraging the OpenTelemetry Collector’s extensibility. The Collector acts as a central point for receiving, processing, and exporting telemetry data. You can write a custom exporter that translates OpenTelemetry’s trace and metric data into a format suitable for PostgreSQL, such as JSON. This gives you fine-grained control over the data transformation process and allows for customization to match your specific database schema. This approach, while requiring more development effort, offers the greatest flexibility. Remember to consider efficient error handling and batching for optimal performance, especially with high-volume data streams. You’ll need familiarity with Go or another language supported by the OpenTelemetry Collector.
Efficient Data Ingestion Strategies
Simply exporting the data isn’t enough; efficient ingestion is crucial for minimizing performance bottlenecks. Consider using batch processing to reduce the number of database interactions. This significantly improves efficiency, especially when dealing with high-throughput telemetry streams. Strategies like buffering and asynchronous processing can further enhance performance. Furthermore, optimizing your PostgreSQL database schema for the expected data structure will greatly impact query performance and reduce storage requirements. Techniques like proper indexing and partitioning can make a substantial difference, particularly when working with large datasets.
Choosing the Right PostgreSQL Extension
PostgreSQL itself doesn’t natively understand OpenTelemetry data formats. Therefore, consider using extensions that facilitate JSON processing and time series management. Extensions like pgcrypto for enhanced security and timescaledb for time-series data can greatly improve the efficiency of storing and querying your telemetry data. The choice of extension depends on the structure of your data and your querying needs. Careful consideration of these extensions will ensure optimal performance and scalability of your database as your telemetry data grows. Remember to consult the documentation for each extension to ensure compatibility and proper configuration.
Comparing Different Approaches
| Method | Complexity | Flexibility | Performance |
|---|---|---|---|
| Custom Exporter | High | High | Moderate to High (depending on implementation) |
| Third-Party Tools (e.g., using Prometheus and a bridge) | Medium | Medium | Moderate |
Remember to choose the approach best suited to your technical skills and infrastructure. OpenTelemetry Collector Documentation can provide further details on building custom exporters. For further information on PostgreSQL extensions, refer to PostgreSQL Documentation.
Efficiently integrating OpenTelemetry with PostgreSQL provides a robust solution for analyzing your application’s performance and behavior. By following these strategies and choosing the right tools, you can unlock valuable insights and make data-driven decisions to optimize your applications. Start experimenting with different approaches and find the perfect fit for your needs. TimeScaleDB Blog offers additional resources on managing time-series data in PostgreSQL.
#1 A Beginner’s Guide to OpenTelemetry
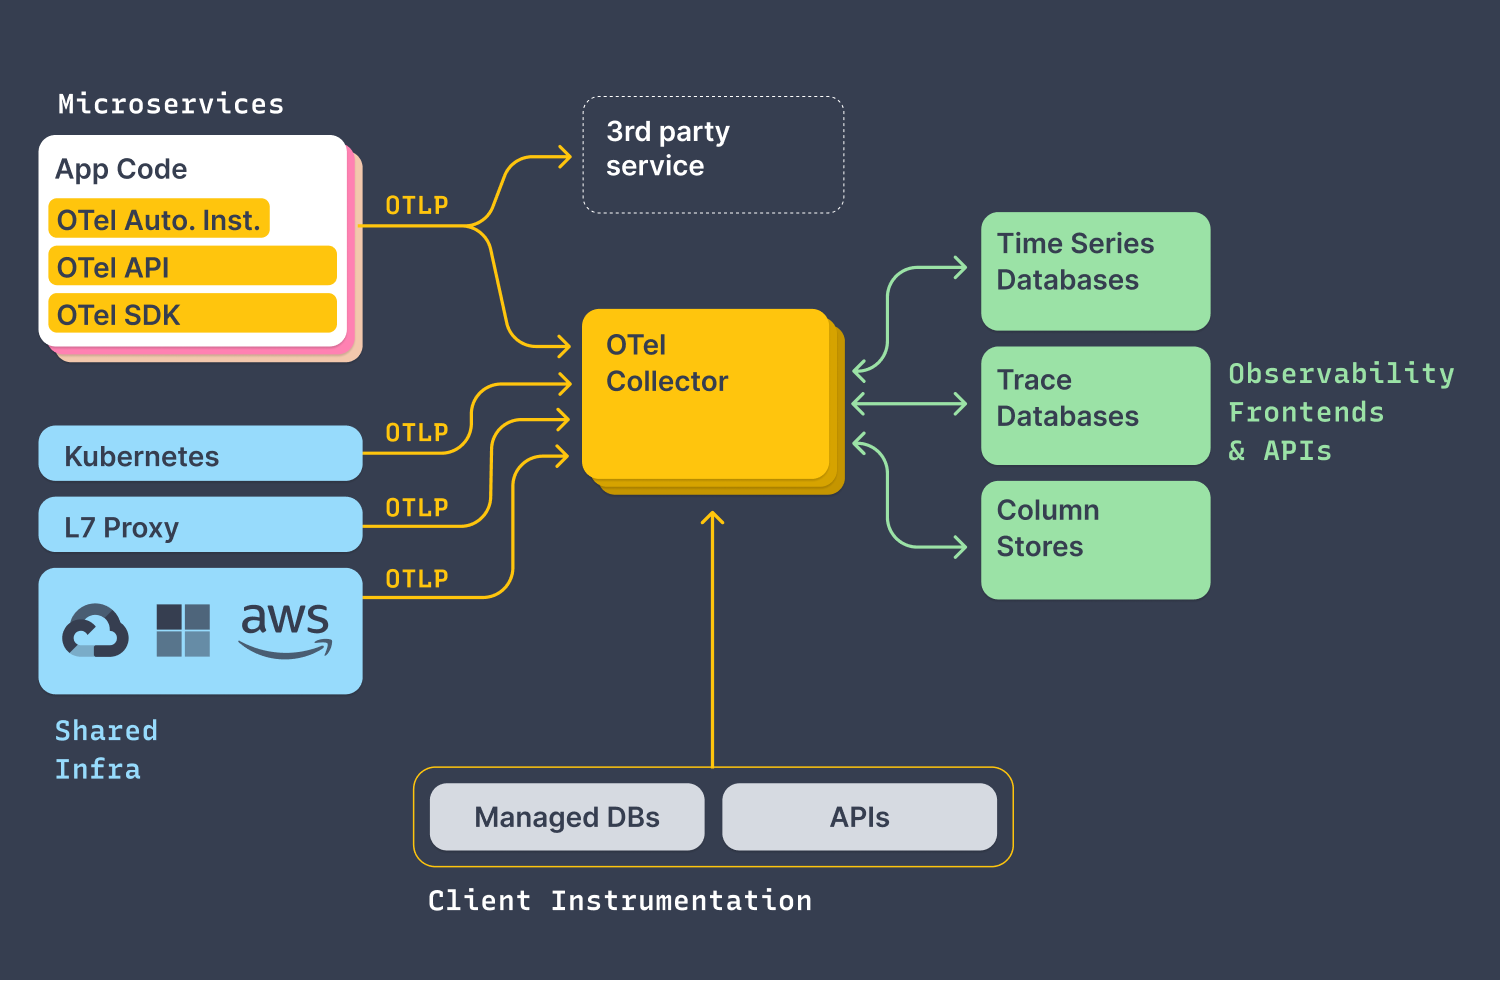
#2 The OpenTelemetry Collector as a platform for monitoring integrations
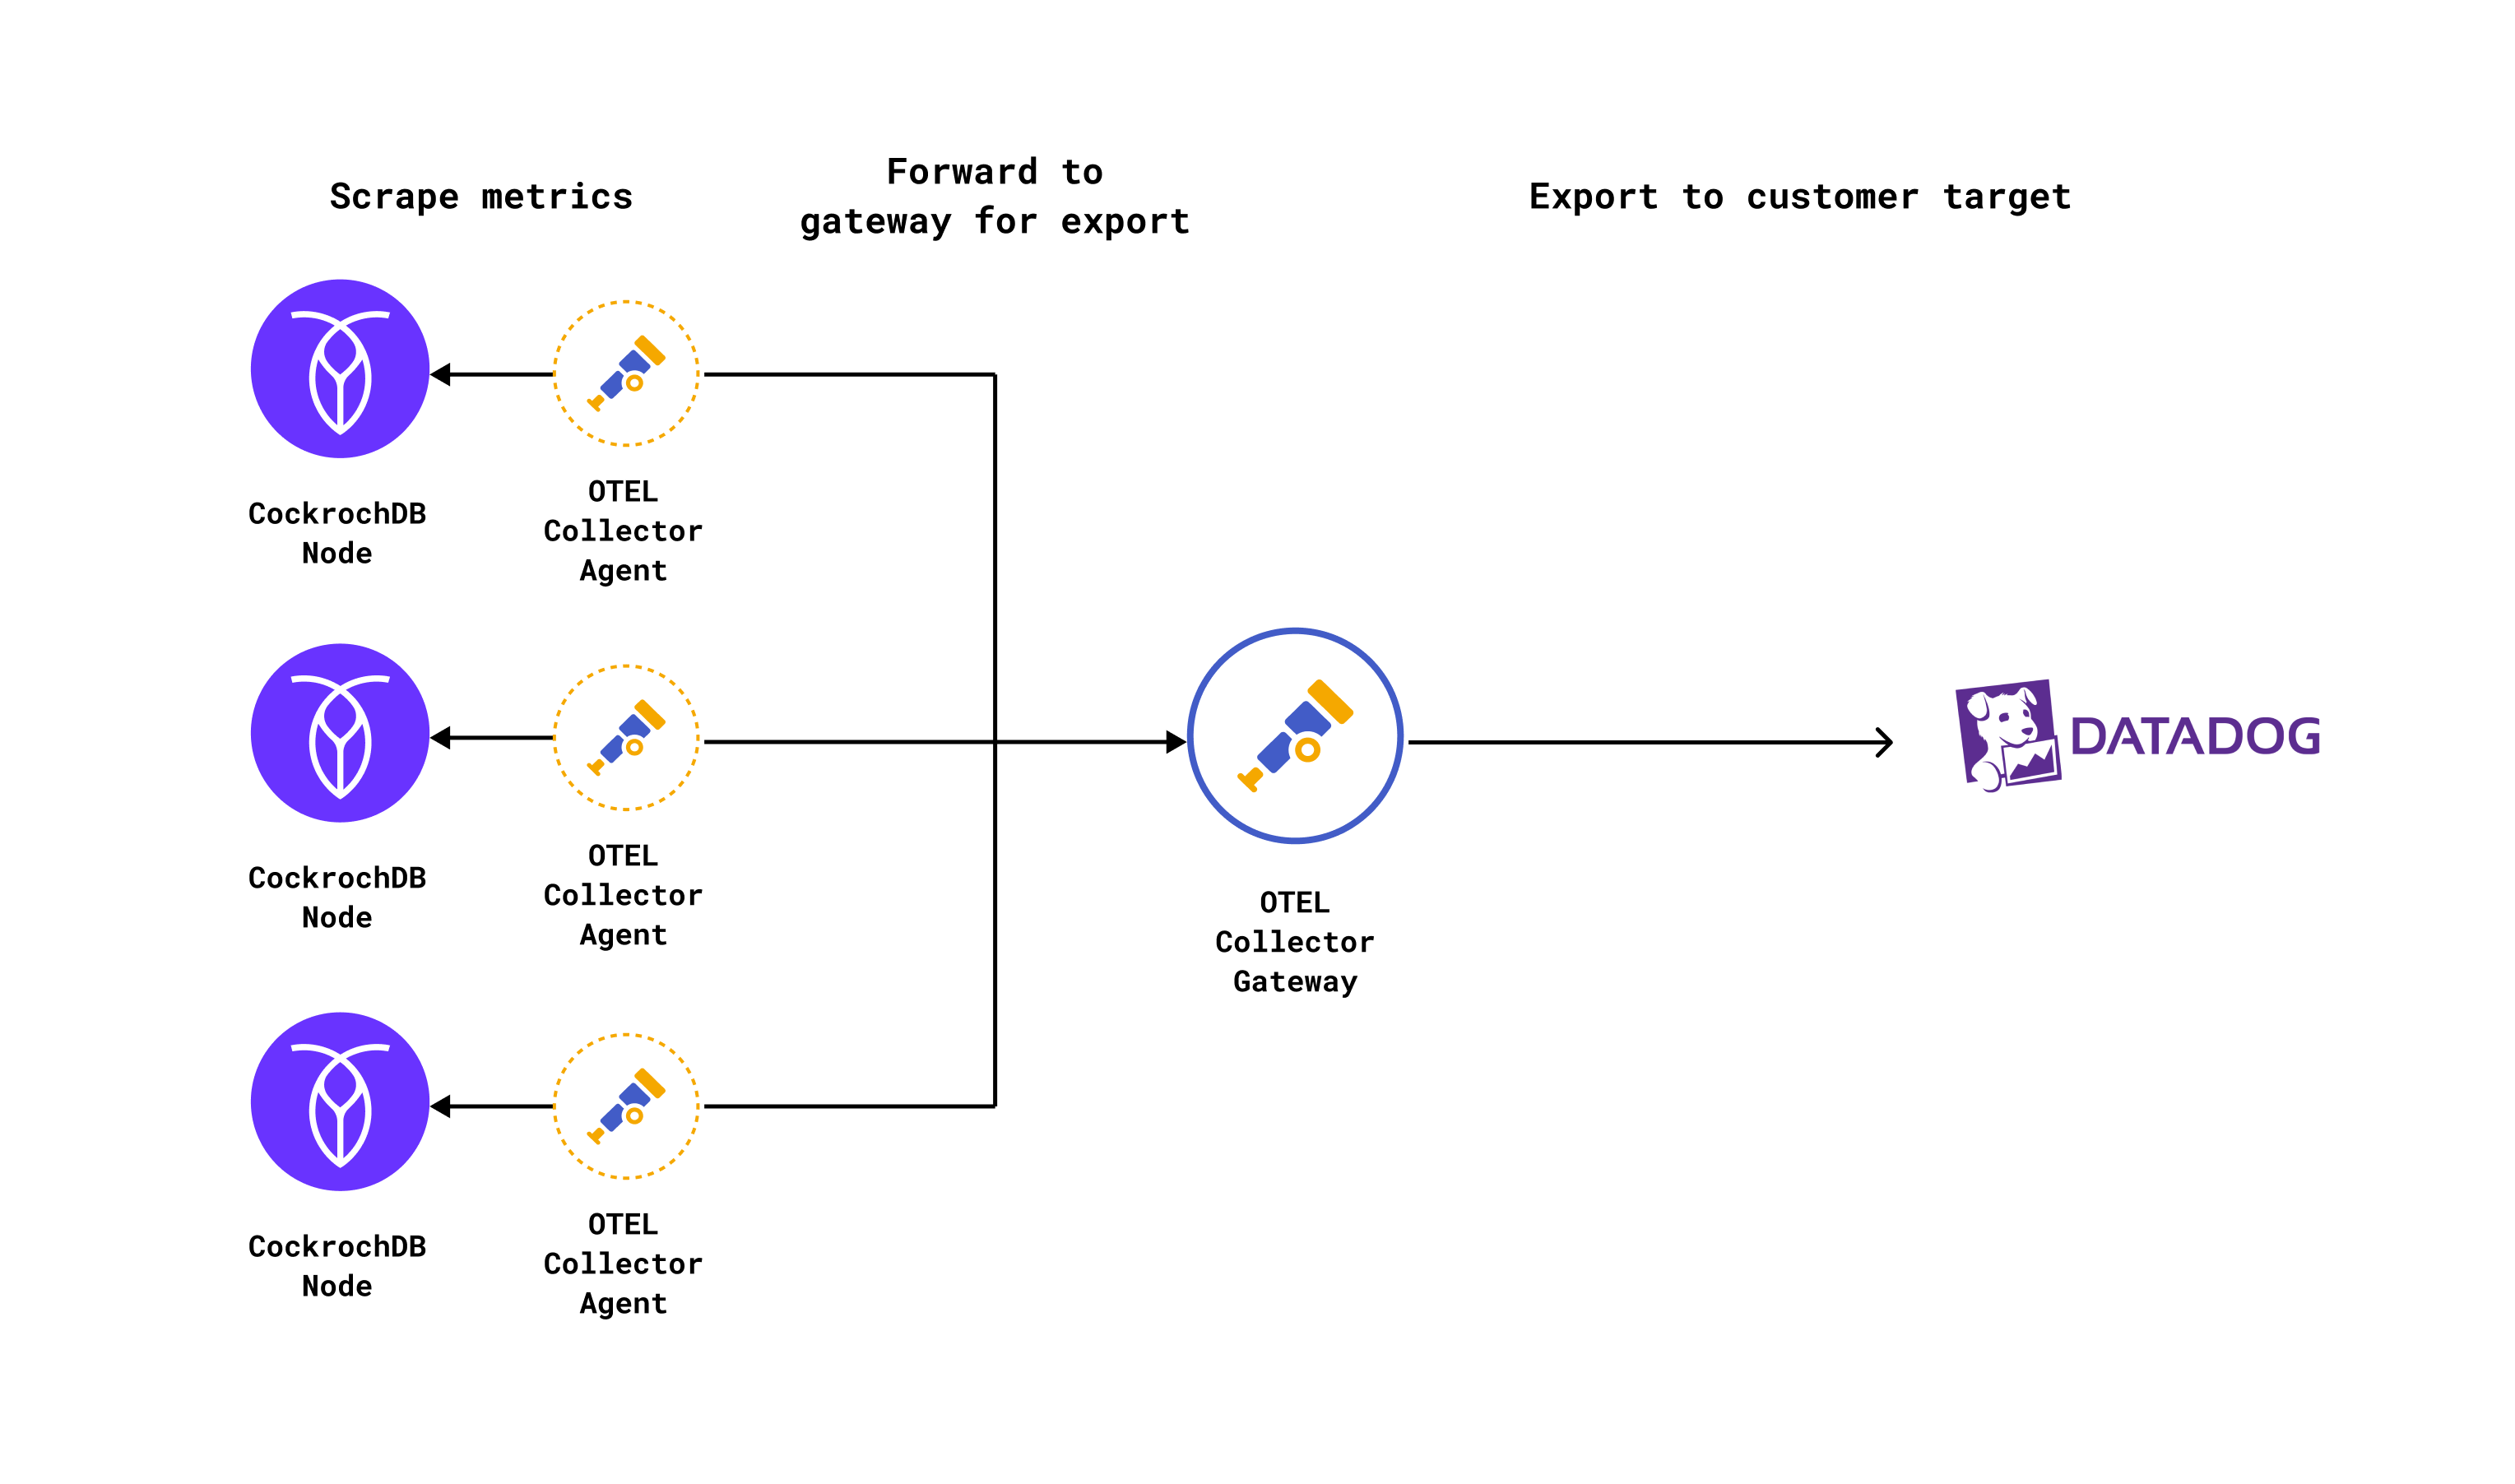
#3 OpenTelemetry Collector: A Friendly Guide for Devs | Aspecto

#4 OpenTelemetry Collector - architecture and configuration guide | SigNoz
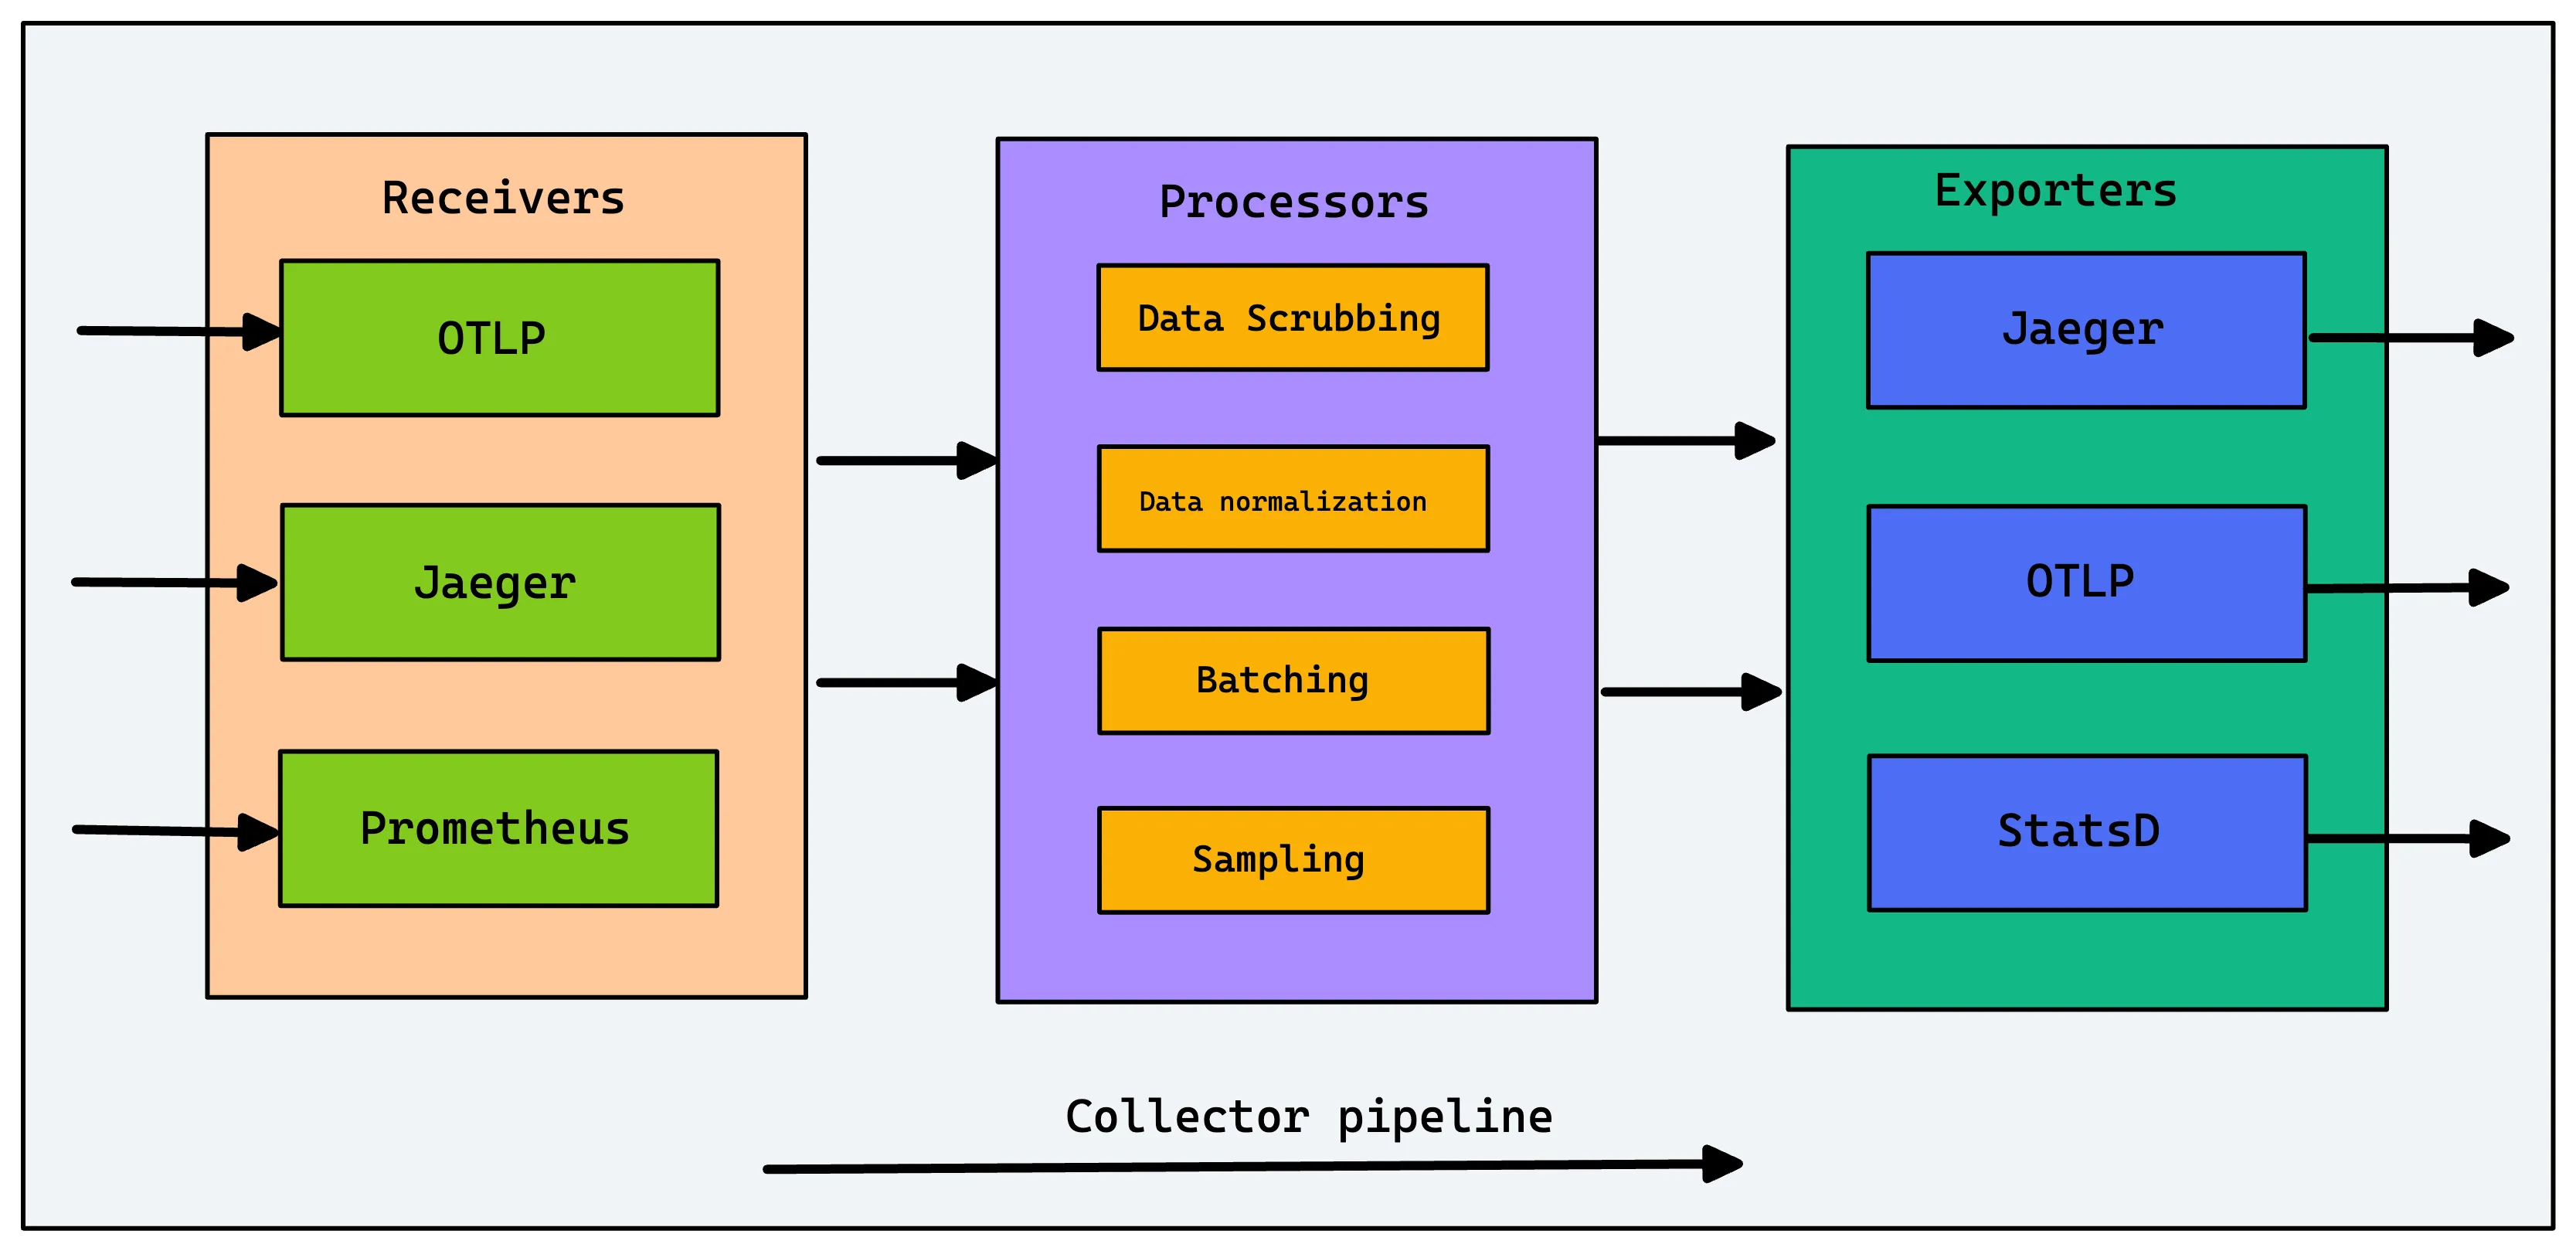
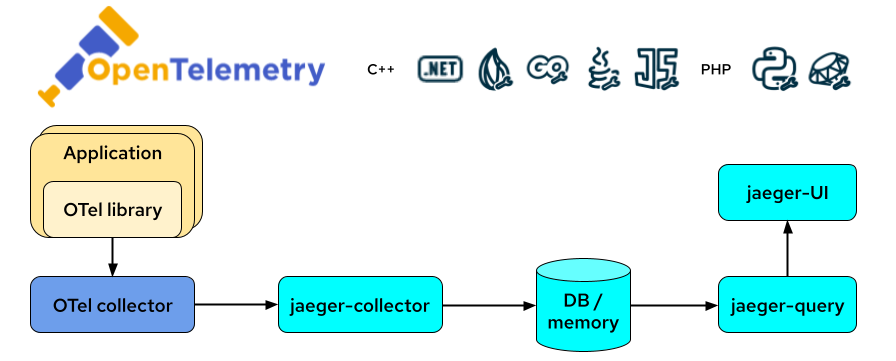
#5 Using OpenTelemetry and Jaeger with Your Own Services/Application
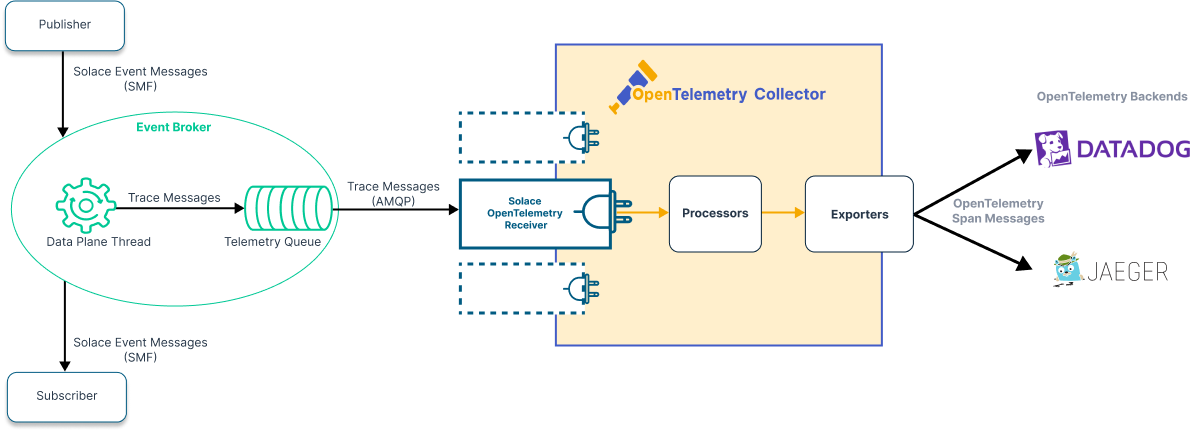
#6 Solace Open Telemetry Receiver
#7 What Are Traces, and How SQL (Yes, SQL) and OpenTelemetry Can Help Us

#8 Choosing an OpenTelemetry backend - Things to keep in mind | SigNoz
